Session 12 - Spatial analysis and cell interactions#
Goal: Learn a variety of tools within QuPath to analyze the spatial relationships between cells
YouTube video walkthrough: Session 12 starts around minute 18.
1. Create Tingible Body Macrophage Annotations#
When analyzing spatial relationships, detections are characterized by their centroids while annotations are characterized by their boundaries. To determine if macrophages are plausibly touching T cells, we need to measure distance from the macrophage boundaries. Therefore, we need to create annotations around the macrophage. There are two ways to do this:
Convert detections to annotations with a script
Pros: computationally fast, utilizes object classifiers, finds TB Macs in the entire tissue
Create new annotation objects
Pros: no scripting, limits potential area to germinal centers
We’ll go through both in the workshop (time permitting)
Option 1- Turn detections into annotations with a script#
The script below takes the all of the detection objects currently classified as TBMacs and creates annotations with the exact same shape. It then deletes the detection objects.
Copy paste the script into the Script editor window and run it (Run > Run). If you named your macrophages anything other than ‘TBMacs’ (case sensitive), change line 2 to have your class name.
def macs = getDetectionObjects() //find all detection objects
def tbmacs = macs.findAll{it.classifications.contains('TBMacs')} //filter for the tingible body class
def newAnnots = tbmacs.collect{ //loop through each object individually, collecting the results into newAnnots
    //"it" refers to each cell as it goes through the loop
    PathObjects.createAnnotationObject(it.getROI(),it.getPathClass(),it.getMeasurementList()) // create an object with the same region of interest, classification, and measurements
}

addObjects(newAnnots) //add the new annotations to the image. Without this, you cannot see or save them.
removeObjects(macs,true) //delete all detections, because we're done with them
Option 2- Create annotations directly from the pixel classifier#
Since tingible body macrophages are predominantly found in the germinal center in tonsils, and they are the dominant CD11c+ CD68+ cells in the germinal centers, we can skip the entire object classifier step and directly segment GC cells found by our pixel classifier as TB Mac annotations.
For this workshop, I recommend Option 2.
In a real project, which method you should choose depends on the underlying biology There are CD11c+CD68+ cells outside the germinal center. If these are part of the cells of interest, then you want to use Option 1, which finds cells regardless of location. If these are definitionally not the cells we care about, then restricting the region to GCs improves accuracy and makes us less likely to miss small cells.
Delete all the detections (
Objects > Delete > Delete all detections)Create a new class called ‘GC’
Use the annotation tools to mark the germinal centers in the tissue section. Give them the GC class.
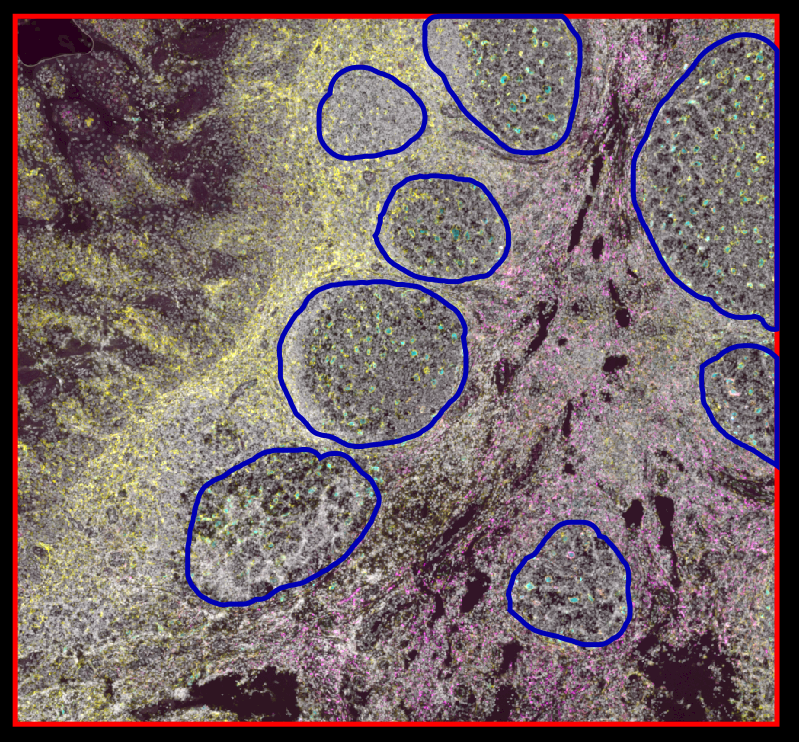
Select all of the germinal centers
Load the pixel classifier
Classify > Pixel classification > Load pixel classifierChoose model “TBMacs”
Create objects
Choose parent objects: “Current selection”
Same options as previously, except New object type = “Annotations”
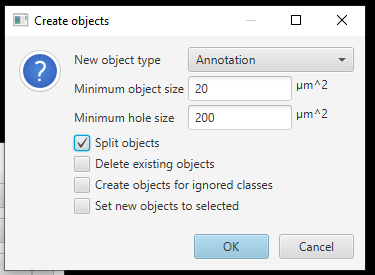
Click OK
2. Segment other cells#
We are about to create cells in the full tissue, but we don’t want it to erase the germinal center and macrophage annotations. So, we’ll need to alter the hierarchy before cell creation.
Segment all cells#
Delete the full image rectangle. KEEP child objects!
Create a new full image rectangle. Do NOT re-resolve the hieararchy. We specifically want the germinal centers to be unassociated wtih this rectangle.
Select the full image rectangle
Run InstanSeg:
Extensions > InstanSeg > Run InstanSegPick whichever channels you feel are appropriate
I don’t recommend running measurements
If you cannot detect the cells in a reasonable amount of time, download the project “Proj2 - Raw InstanSeg” and proceed from here!
Remove cells inside the created annotations#
Measure the distance from each cell to the nearest macrophage object
Analyze > Spatial Analysis > Signed distance to annotations 2DClick Yes when it asks to split multipart classifications?
This will take a minute.
Look at the measurements for each cell. The ones inside the macrophages have a negative value for ‘Signed distance to annotation with TBMacs µm’.
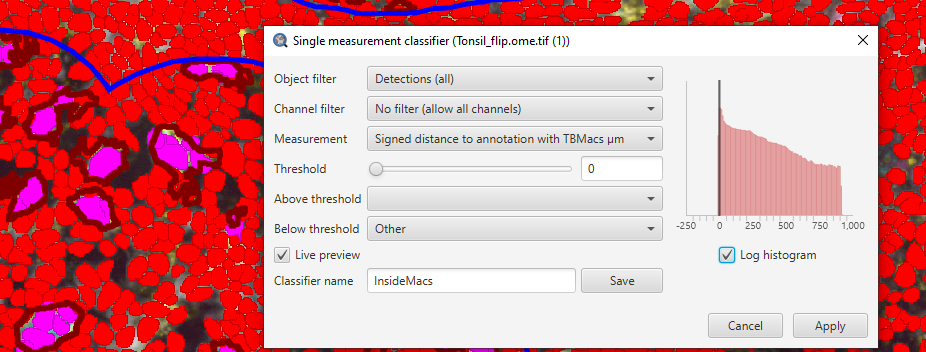
Remove the InstanSeg-created cells that are located inside the macrophage annotation objects in order to reduce duplication
Classify > Object classification > Create single measurement classifierSet the measurement to ‘Signed distance to annotation with TBMacs µm’
Set the threshold to 0
Set the Below class to anything not already claimed. I used “Other”
Give the classifier a name, Save, and Apply
Select all Other cells (or whatever class you used) and delete them.
Now, all of the InstanSeg cells created around the nuclei that were already segmented by our macrophage pixel classified are gone!
3. Quantify cell-cell interactions#
Train a classifier for PD-1
Select all cells
Measure the mean, min, max, standard deviation, and Haralick features of the PD-1 and Ki67 channels
Select the GC objects and lock them. (
Right click > Annotations > Lock)Use the points annotation tool to train an object classifier for PD-1+ cells,
Using Ignore* as the negative class
Use only PD1 channel measurements
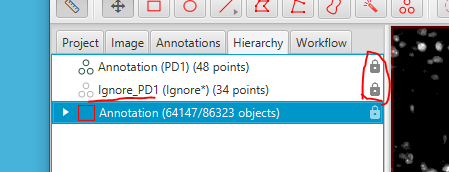
For reasons that will become clear in a second, name the Ignore* pts annotation object “PD1_Ignore” (Right click on the annotation > Set properties > type a name)
Train a new classifier for Ki67
Lock the two point annotation objects. Locked annotations are not used when training a classifier
Close the “Train object classifier” window and reopen it.
Train an object classifier to find Ki67+ cells
Use only the Ki67 measurments.
Create a new Ignore* point object named “Ki67_Ignore”
Create a classifier to identify cells very near macrophages.
Classify > Object classification > Create single measurement classifierSet the measurement to ‘Signed distance to annotation with TBMacs µm’
Set the threshold to 5 (remember, you’ve already deleted cells with distance <0)
Creating a “touching” class. Set the Below class to “touching”
Give the classifier a name, Save, and Apply
Combine the 3 classifiers.
Save the file. Duplicate the image, with a relevant name. Delete the training points.
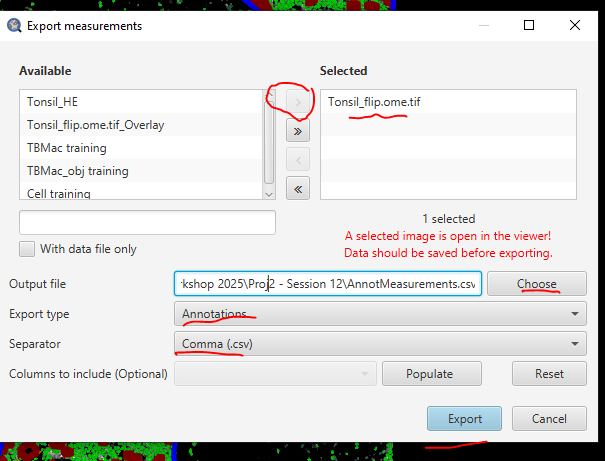
Export the annotation measurements
Measure > Export measurements2. Use these settings:
Are the cells near Tingible Body Macrophages more likely to be PD1+ than the ones further away?#
Open the exported .csv in Excel.
Limit the file to germinal centers
Filter the data on Column E “Classification” to hide all GC rows
Delete the remaining rows
Turn GC rows back on
Immediately save the file with a new name to preserve a copy of the data you just deleted.
Simplify the file
Delete columns B-I: Object ID, Object type, Name, Classification, Parent, ROI, Centroid X, Centroid Y
Delete the Area and Perimeter columns
Calculate the total frequency of PD1 cells in each germinal center
Make a column “PD1% GC”
Add the cell counts in any column that has “PD1” in it’s label.
Divide the sum by the total number of detections and multiply by 100

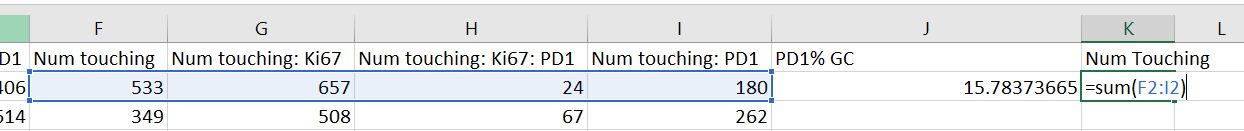
Calculate the total number of cells touching macrophages by adding the cell counts in every column labeled “touching”
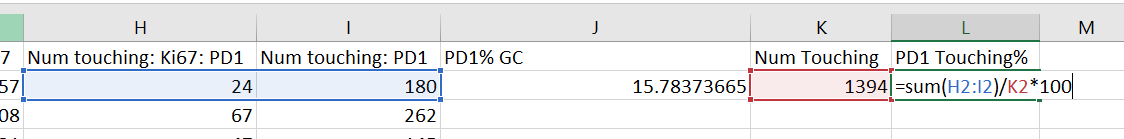
Calculate the percentage of touching cells that are PD1+ by adding the counts of PD1+Touching cells divided by the total number of touching cells
Calculate the ratio of PD1 Touching% to total GC PD1%: \(PD1 Touching% / PD1 GC%\)
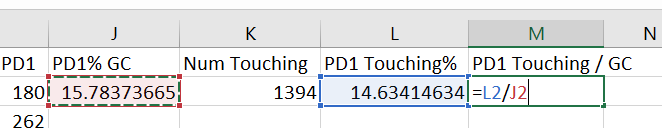
Drop down the formulas to calculate for all germinal centers
Calculate the average. Remember to account for error rates when deciding whether to trust data.
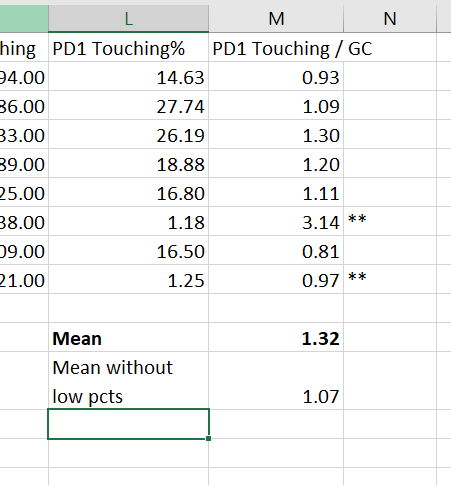
Result: Not in this sample!
Bonus assignment Repeat all of those calculations for Ki67.
Are the Ki67 cells near the PD1 cells?#
Back into QuPath!
Turn on the Ki67 and PD1 channels.
Create a Density Map for the Ki67 showing the light zone of the germinal center
Analyze > Density maps > Create density mapTake some time to play with the settings and see how the affect the result.
Make sure you have your classifier visible
Here is one example of reasonable settings, but there are many good choices:
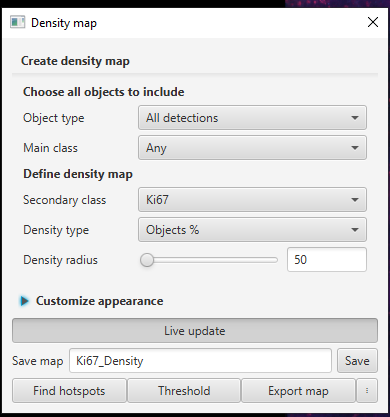
Give it a name and Save
Create annotations about Ki67 dense areas
Select all of the GC annotations
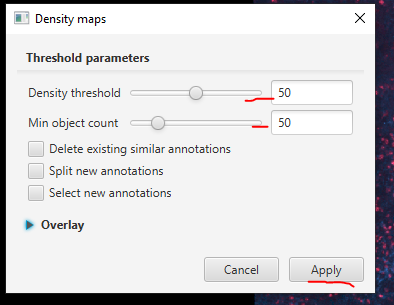
Click Threshold
Adjust the threshold parameters until the Ki67-dense light zone is well highlighted
Recommended settings: Density = 50; Min object count = 50; but these will depend heavily on your density map settings
With your GCs selected, click Apply
Similarly, create a density map for PD1 cells.
I recommend using the same map type and radius, but the thresholds can/will be different
Save it as a new map
Use the
Thresholdfeature to create annotations around the PD1-heavy region
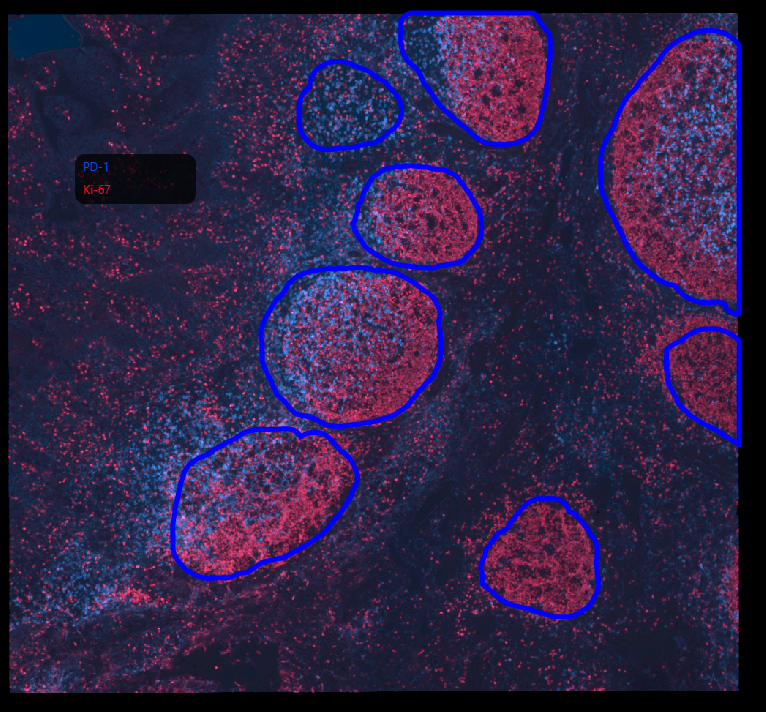
Example results:
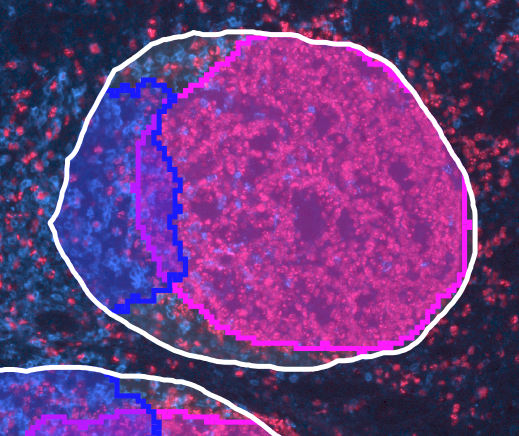
While there’s some overlap, for the most part PD1 cells localize separately from Ki67 cells!