Session 2- Annotation Tools#
Goal: How to segment tissue automatically and manually
YouTube video walkthrough: Session 2
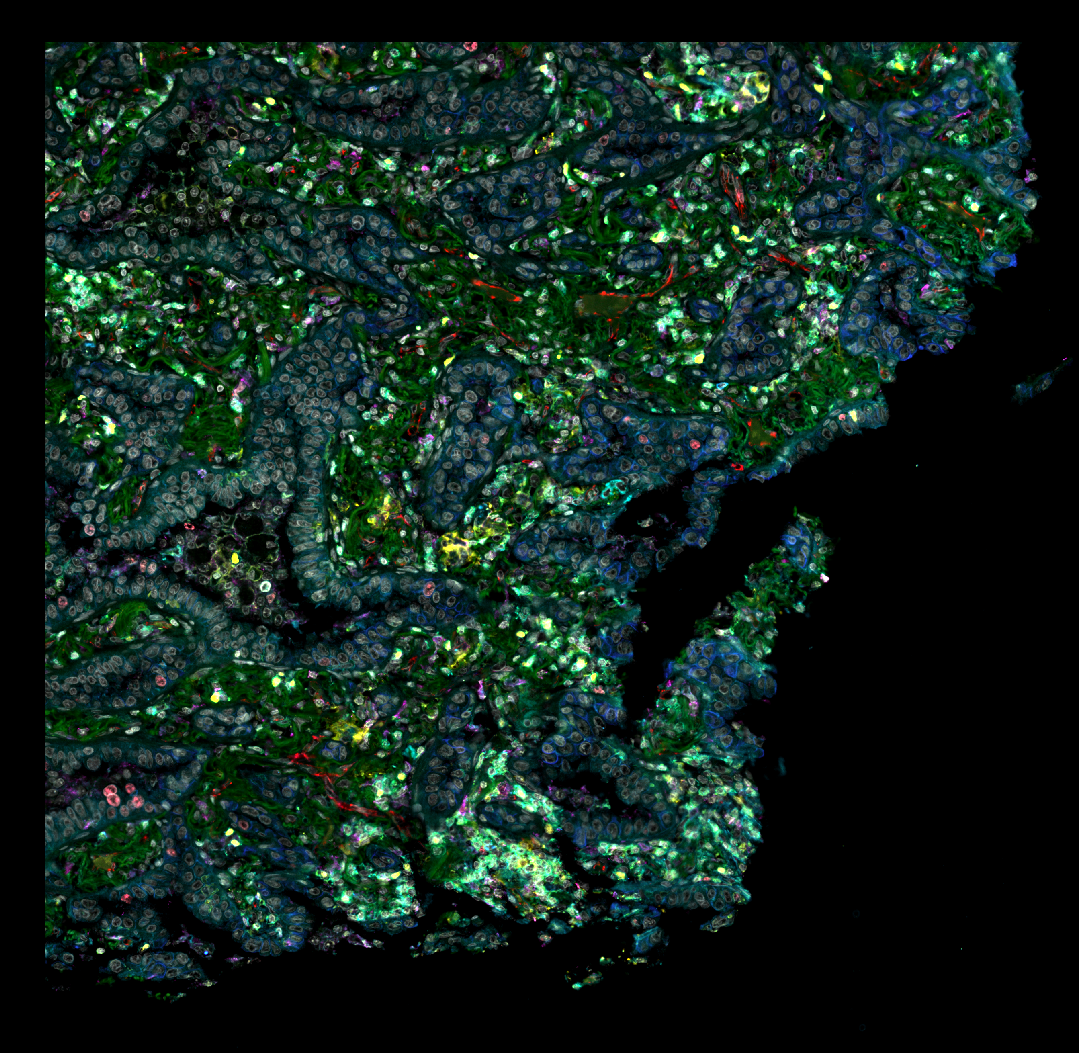
We are starting with LungImg2.ome.tiff. It will look something like this, though your colors will be different:
1. Create a Tissue Annotation to define the tissue area#
To find all of the area that is near a nucleus, use a thresholder on the Hoechst channel with smoothing.
Classify > Pixel classification > Create thresholder.Set your settings to these:
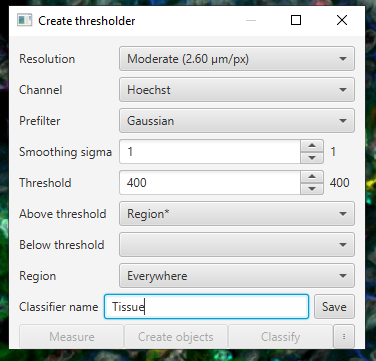
Save the classifier
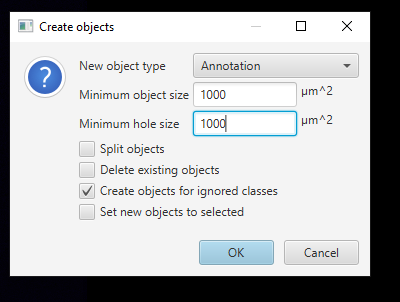
Click
Create objects > Full image. Then use these settings:
Go to the Annotation tab, then double click inside the annotation you just created. You can see basic measurements: Area, Perimeter, Centroid location. More measurements will be added later.
2. Use manual annotation tools to define an area#
We’re going to try to mark the cancer area manually to practice using the Annotation tools. We’ll use these skills to learn a more automated way later. Practice with these tools to mark the S100+ region, with only the S100 channel on.
Brush:

Polygon:

Wand:

Things to note:
Hit Alt (or ⌥ on Mac) to turn the brush or wand into an eraser!
You can mix and match the tools whenever convenient. I like to add with brush and then clean up mistakes with wand.
The Wand and the Brush change behavior based on your zoom
While drawing, you can hit Ctrl (or ⌘ on Mac) + Shift to stop an annotation at an existing boundary.
Ctrl (or ⌘ on Mac) + Z to undo!
For more information about annotations, see here: https://qupath.readthedocs.io/en/stable/docs/starting/annotating.html#brush-tool
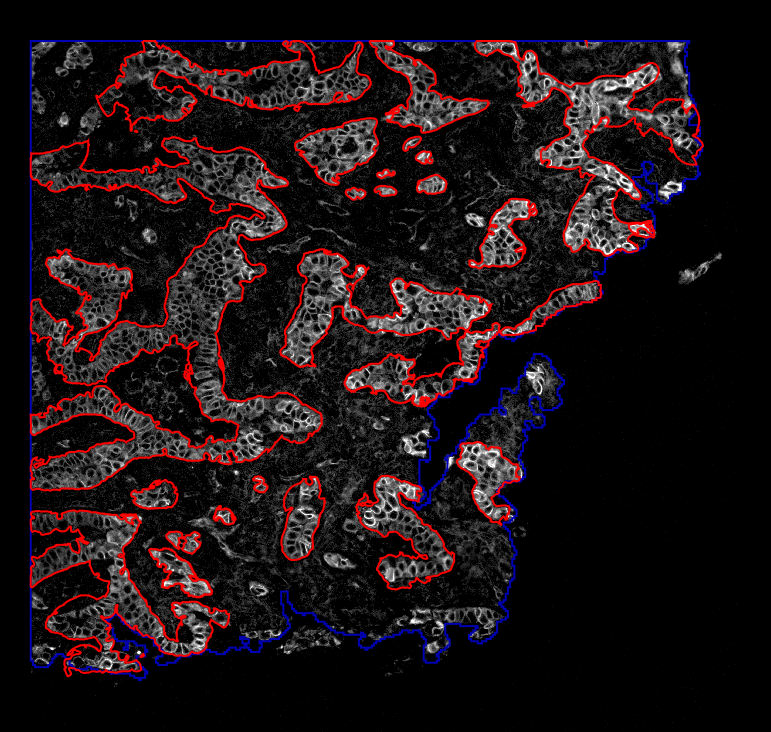
Your final results will look something like this:
3. Combine the areas to measure tumor burden#
Your Annotations tab will look something like this:
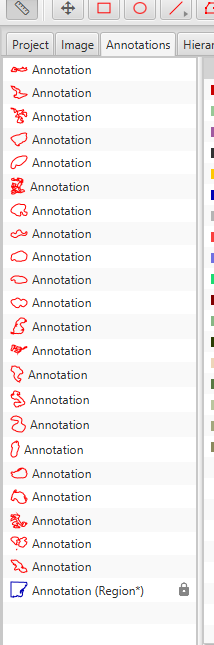
Select everything except the Region* annotation that outlines the entire tissue.
You may shift select multiple objects (like handling files) in
Annotationstab or Ctrl + left click each annotation you wantTo automatically select all unclassified objects, in
Annotationstab, right click onNone(if you have assigned no class yet), then at the bottom of the context menu clickSelect objects by classification.
To merge them into a single, complex annotation:
Right click > Annotations > Edit multiple > Merge selectedSelect the new annotation that defines the entire cancer region. Then, in the Class list on the right, select Tumor.
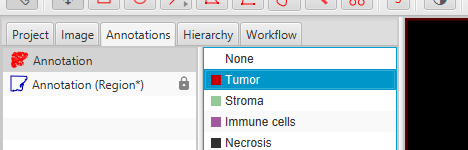
Click
Set Selectedto assign the selected S100 annotation the class “Tumor”.
Right click on the annotation within the Annotation list.
Right Click > Set Properties. Give it a name.Click on the tumor annotation, then, at the bottom of the Annotations tab (lower half), look at the total S100 Area. In your favorite calculator program, divide that by the total tissue area to quantify the cancer burden.
My results are \(168700 / 476700 = 0.35%\). 35% of the tissue area is positive for S100.