Session 4 - Cell Detection#
Goal: Learn 2 methods for detecting cells in multiplex images, including the pros and cons of each
YouTube video walkthrough: Session 4
Sharing and downloading QuPath projects#
If you ever fall behind during the training course, you can download a pre-cooked project from Google Drive. (named by session name- right now, you would want “Proj1 - Session 4”, which will have the tissue and tumor annotations). Alternatively, you may one day need to share a QuPath project with a collaborator or between computers or store it on a backup drive for safekeeping.
If you want to continue using the tissue segmentation you just created- great! This is just here as a reference in case you need it some other time.
Transferring a QuPath project#
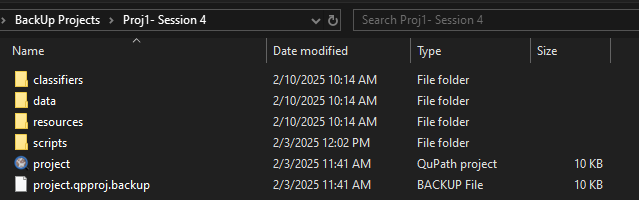
To transfer a QuPath project, you must share: - The entire project folder that you created when you first began working, including the .qpproj file and all subfolders - Separately, the raw images files The benefit of keeping the images files separate from the QuPath project folder is that you can trasnfer the large image files once, and then share versions of the much smaller project folder back and forth as often as you’d like.
Here are the contents of the “Proj1 - Session 4” folder:
Cell Method 1- QuPath’s Built-In Cell Detection#
Select the whole tissue annotation
Analyze > Cell detection > Cell detection

Start with these settings:
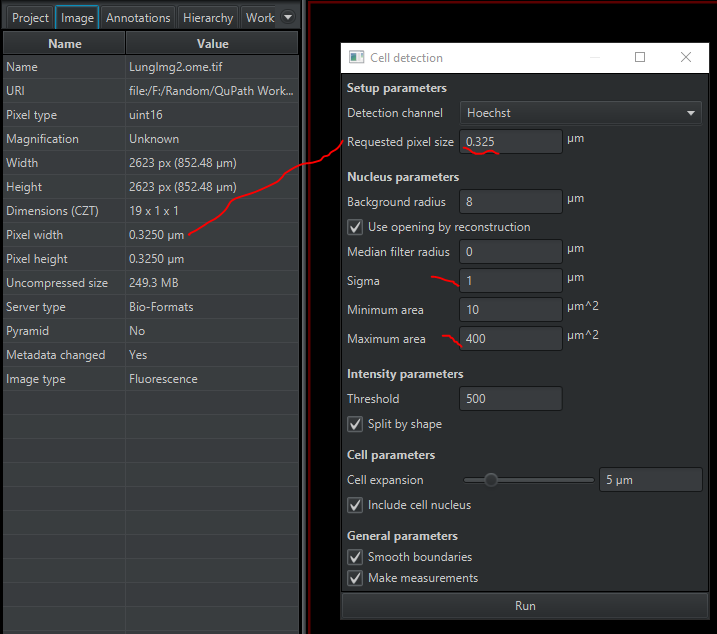
Oh No! My Tumor Annotation Disappeared! When you detect cells, it deletes the ‘child’ objects in the hierarchy. Don’t worry, we will get it back!
Spend a few minutes adjusting the settings and rerunning the cell detection. Some settings will look better for the tumor cells, some will look better for the inflammatory cells. Find what looks best overall.
If you are interested in more detail about the settings themselves, you can check out the FS2K2023 session on cell detection, or read about them here.Click on the tissue annotation in the Annotation tab. In the measurements table, it tells you the total number of cells - as
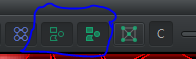
Num detections. The area is in square microns. To convert to square mm, multiply by \(1000*1000 = 1e6\). You can calculate cell density as: \(NumCells / Area * 1000000 = cells / mm^2\)You can visualize the nucleus, the cell membrane, or both by right click > Cells and choosing one of the options there. You can turn the detection outlines on and off with D and fill them in the F (or these buttons):
Understanding Detection Measurements#
Select any cell (usually double click, though this can vary) and look at the measurements table in the Annotations tab. It gives you a variety of shape and intensity measurements for each cell.
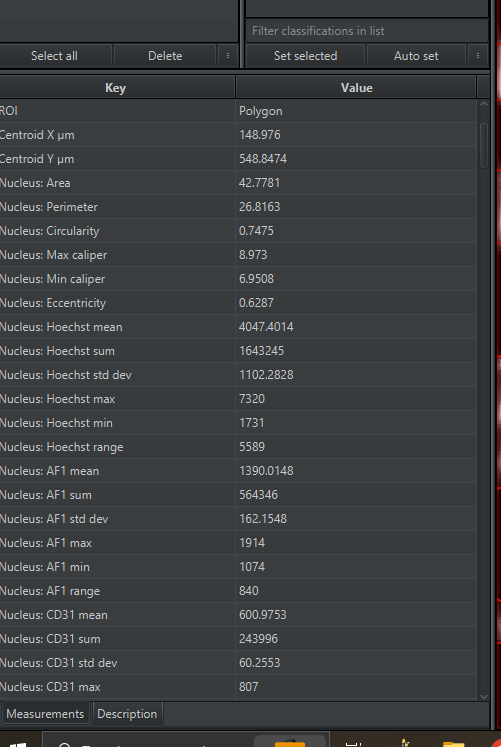
Open up the detections measurements table
Measure > Show detection measurements. Things you can do with this table:
Sort by any measurement by clicking on the column header
Double click on a cell to find it in the image
Double click on a cell in the image to jump to that cell in the measurement table
Create a histogram of a measurement
Filter by class (will get to this later)
Method 2- InstanSeg#
To use InstanSeg, you must have QuPath verison 0.6.0. The current most up to date is 0.6.0-rc3.
See the debut of InstanSeg at FS2K2023!
One-time setup for InstanSeg#
Extensions > Deep Java Library > Manage DJL ExtensionsUnder PyTorch (default) click Check / download
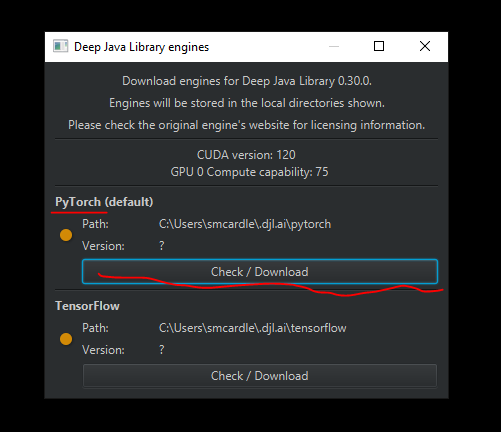
This may take a while to download, the orange circle will turn green when it is done. You can then close this window.
NOTE: We are not covering using the GPU here. For further information about PyTorch GPU acceleration, see the documentation
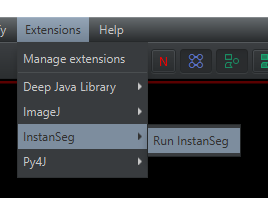
Start up Instanseg with:
Extensions > InstanSeg > Run instanseg
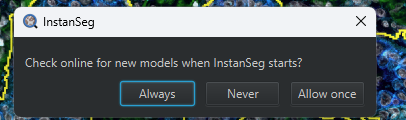
The first time you run InstanSeg, it will ask you about checking the internet for new models. Click “Allow once”.
InstanSeg will need to download some pre-trained models.
Choose the location on your computer where you want them saved by clicking on the folder icon
Select the fluorescence_nuclei_and_cells model from the dropdown
Click the download button.
If the model downloads correctly, the cloud icon on the left side of the dropdown will disappear.
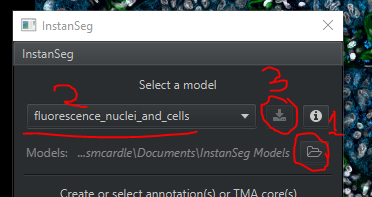
Note: your buttons will look slightly different because I had previously downloaded the models
Running InstanSeg#
We’re going to save the built-in cell detection results so that we can compare them to the InstanSeg results. The easiest way to do this is to duplicate the image.
Save your work!
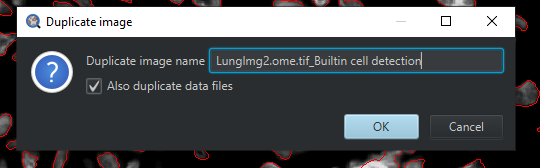
File > Saveor Ctrl + SIn the Projects tab, right click on the current image >
Duplicate image. Name the new image ‘LungImg2.ome.tiff_Builtin’ or similar. Keep the “Also duplicate data files” option checked.A new image entry will be created in the Project tab.
Delete the existing cells with
Objects > Delete > Delete all detectionsStart up Instanseg with:
Extensions > InstanSeg > Run instansegClick on the dropdown “Input channels”. Select only those you believe will be helpful for segmenting cells. You should always include the nuclear marker (Hoechst), and whatever membrane and cytoplasmic markers that show cell boundaries. Definitely uncheck the two blank channels.
UNCHECK
Make measurementsDraw a SMALL annotation (~100 cells) around a region that contains tumor and stroma. With that annotation selected click Run
If you are unhappy with the results, try adjusting the input channels. Then, draw rectangles in different regions of the image to test the settings. Iterate until you are satisfied or until the results stop improving. It’s generally not worth tweaking the other input parameters unless you know a lot about your computer hardware.
When you have your final settings, delete all rectangles that you made for testing. Select the tissue annotation and run InstanSeg one more time (this will be slow)
Comparing Results of different segmentation methods#
Save your work!
Use Multiview Mode. On the image,
Right Click > Multi-view > Set grid size > Grid 1 x 2 (horizontal)A new viewer will be created to the right. Click on it (it will be subtly outlined in red). Double click on the image LungImg2.ome.tiff_Builtin to open it in the new viewer.
Synchronize the viewers
Right click > Multi-view > Uncheck 'Synchronize Viewers'(unintuitive but important for resetting them)Click on one of the images. Press the full screen button.
 . Repeat for the other side
Right click > Multi-view > Check 'Synchronize Viewers'Open Brightness / Contrast

Check “Apply to similar images” at the bottom
Full method:
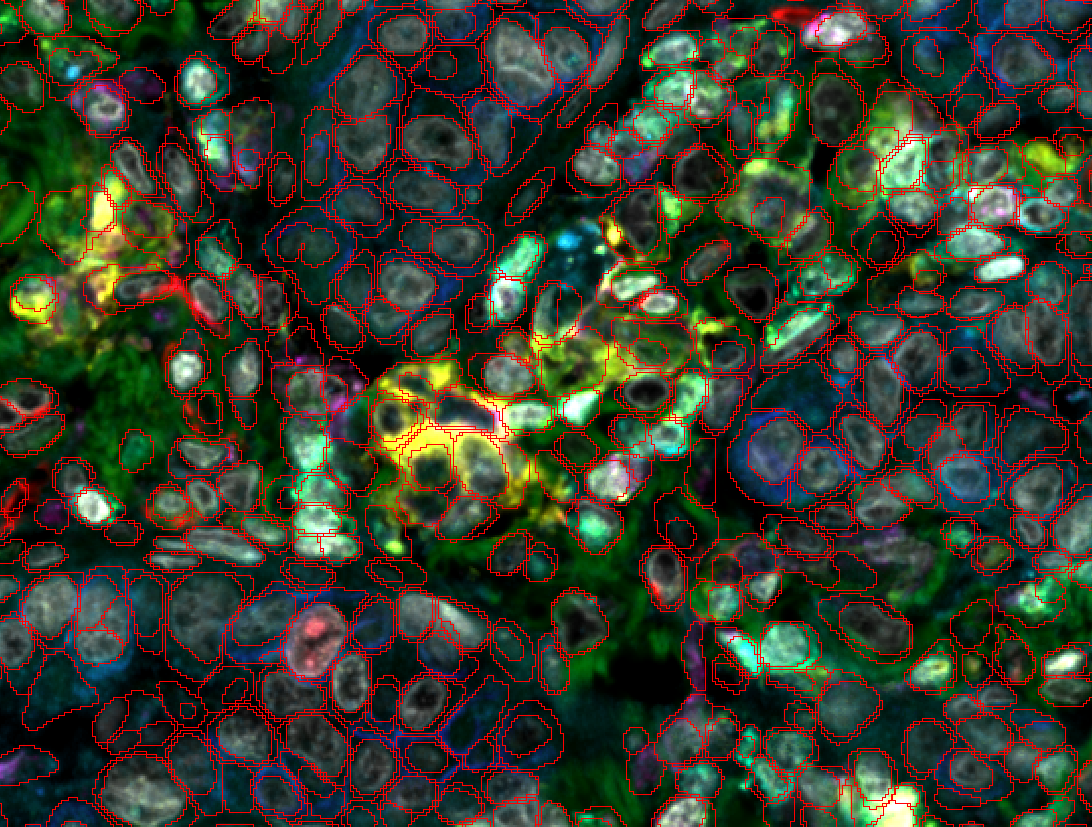
Zoom in to any spot. Compare the results of the built-in (Watershed-based) cell detection and that of InstanSeg. Make sure you look at different cells types and many regions. Only you can determine if the extra time needed for InstanSeg is worth the increased accuracy for your project!
To close the multiviewer,
right click on the image on the right > Multi-view > Close Viewer. Then,right click on the left image > Multi-view > Set grid size > Grid 1x1 (single viewer)