Session 1- Getting Started#
Goal: How to set up a project, view multiplex files, and export images
YouTube video walkthroughs: Introduction Session 1
1. Create a Project.#
The first step in any QuPath work is to create a “Project”, which is a folder that will hold all of the files QuPath needs.
Create an empty folder (if you place the images into the folder first, it will not work!).
Drag the folder into QuPath. Click Yes to create project.
Drag the 3 lung images (from Google Drive) into the open QuPath window.
2. Open an image#
Double click LungImg2.ome.tiff to open. You’ll see this message:
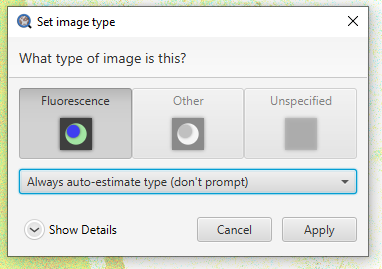
It may take some time to open the image for the first time!
Change to auto-estimate and hit apply
It will look too bright! We’ll fix that next
3. Adjust Visualization Settings
#
Open ‘Brightness/Contrast’

Click ‘Show Grayscale’
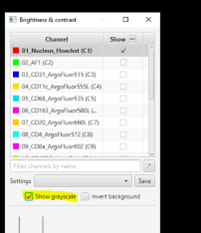
Make sure the Hoescht channel (at the top of the list) is selected
Look at the open image and zoom in (mouse wheel). Adjust Minimum and Maximum until the non-tissue background is gone and nuclei are just saturated enough.
Repeat for all channels.
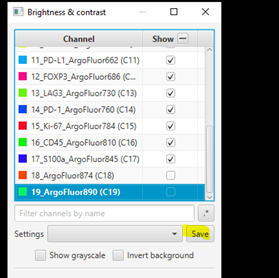
For blank channels (Argo874 and Argo890), I like to move both the min and max to a very high value so that they are never accidentally displayed.
Biological insight is essential to setting display settings correctly. LAG3 is very rare and punctate, S100 is very common and broad. In your own projects, make sure you know what to expect.
It is very common for there to be a large spike in the histogram near the left side - this usually represents a large number of background pixels, so you will want the minimum to be set to the right of this spike.
Uncheck ‘Show Grayscale’
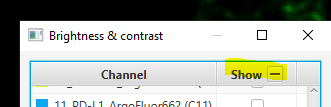
Turn on everything except the blank channels by clicking on the +/- box next to Show and then uncheck individual channel boxes after.
It should look better, but there will still be confusion between channels. That’s ok, we’ll fix it next. Save the Display Settings.
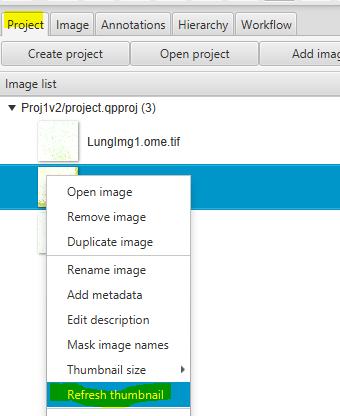
In the Projects Tab, right click on the image thumbnail. Click
Refresh Thumbnailto get a prettier / more descriptive Project Tab entry.
4. Create sets of visualization settings
#
Select a combination of channels that is relevant for different biological processes- Cancer, T cells, Myeloid, etc. Turn those on and the rest off. Some recommendations for those unfamiliar with immune markers:
Cancer: S100a, Hoechst, AF1, PDL1
T cells: CD45, CD4, CD8, FoxP3
Myeloid: CD68, CD163, AF1
Adjust the settings so to maximize clarity for that combination.
Click on colored square to change channel color.
Play with gamma to see how it changes, but be careful! Adjusting the gamma in scientific publications can be seen as fraudulent behavior when not reported!
Save the display settings descriptive names of channels or biological meaning. Then, repeat for a few more combos.
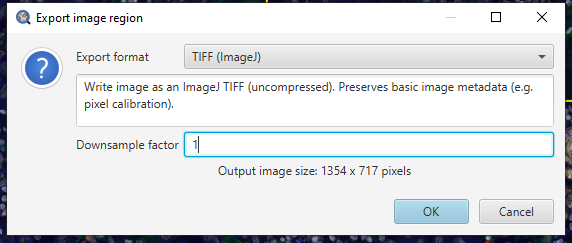
5. Exporting Region Images
#
Use these steps for manuscripts or PowerPoint presentations. Exporting images for further scientific processing is more involved and covered separately.
Create Annotation Regions
Objects > Annotations > Specify Annotation
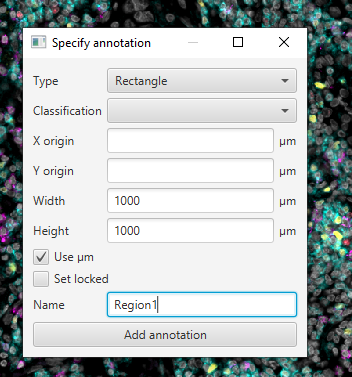
Check ‘Use um’ and type the width and length (Note: the values in the image above may be too large for your image)
Give it a name
Click “Add annotation”
Move the created box to somewhere interesting by double clicking within the annotation box, then left clicking and dragging.
With rectangle selected,
File > Export images > Rendered RGB (with overlays)
6. Viewing Options#
Channel Viewer#
Any time you have more than 3 channels, it is impossible to clearly differentiate all potential overlapping colors. The channel viewer can help clear up confusion by showing the channels independently.
Open the channel viewer with
View > Show channel viewerAdjust the Zoom level by right clicking inside the channel viewer > Zoom > 200%
Adjust the Field-of-view by expanding the window
Turn on and off channels in the B/C settings and watch it immediately update!
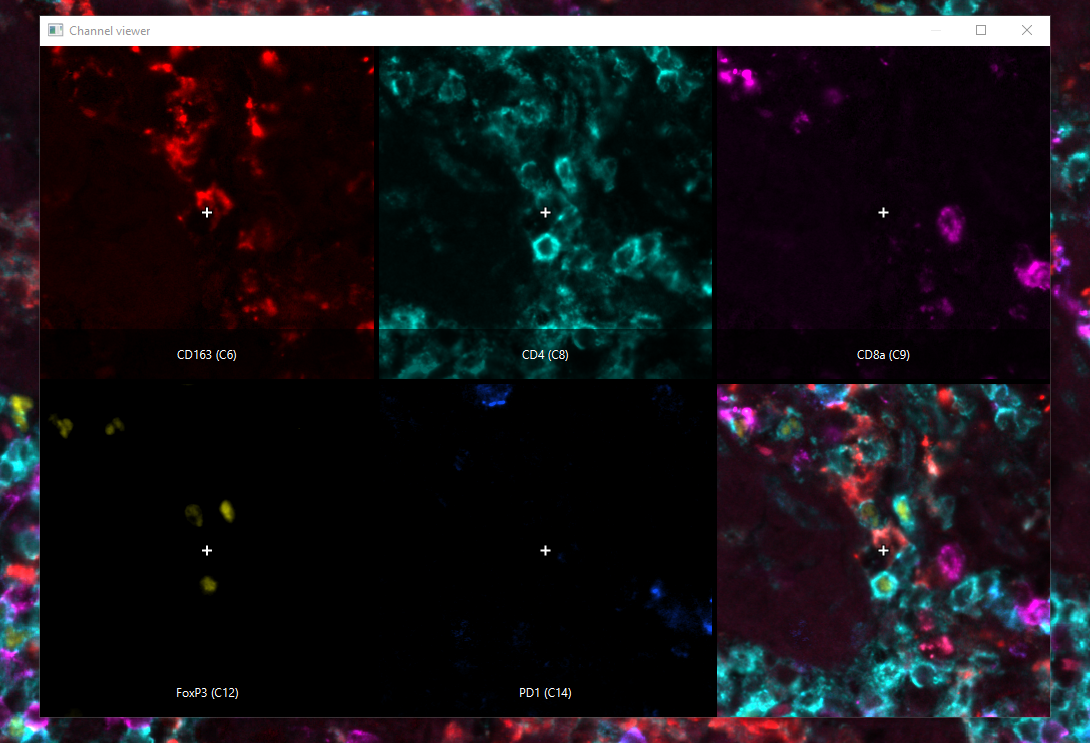
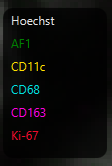
Channel names and colors for presentations pop up
#
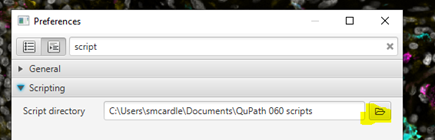
First, you should set up your scripts folder.
Settings - the icon should be in the upper right and look like this!

If your monitor resolution is too low or QuPath window too small, you may need to click on the >> at the top right of QuPath to show this button, and others.Search for “script” and select the “Scripting” dropdown
Set Script Directory - this should be somewhere on your computer where you can store a set of small text files that you can access from any QuPath project.
In the Google Drive folder with the image data, there is a Scripts subfolder. Put everything there into the Script Directory you just set.
Find the script for displaying channels:
Automate > Shared Scripts > ChannelNamesIn Automation window,
Run > Run
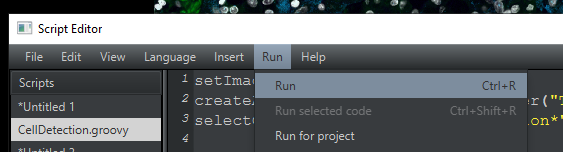
Results:
To export the image along with the names:
File > Export Snapshot > Main Window Screenshot
Good enough for a presentation, not good enough for a manuscript!